
And the legendary fat-burning zone
If you’ve endeavored to lose weight with the assistance of exercise at any point within the last 20 years, you’ve probably come across the notion of heart rate zones and the so-called “fat-burning zone;” that is, an exercise intensity at which your body consumes the most fat. Treadmills, stationary bikes, fitness bands, and smartwatches all partition your heart rate into zones which they claim maximize different aspects of health and training, and one of those zones is inevitably labeled the “fat-burning zone.” But how accurate are these zones? Is there really such a thing as an ideal heart rate for burning fat? Sort of.

First, science
When you begin exercising, your immediate energy needs are met by catabolizing phosphocreatine (PCr) or glycogen (which are predominantly stored right in your muscles for rapid access1) to produce adenosine triphosphate (ATP). In fewer than 20 seconds your reserves of PCr will be consumed, and you’ll have about a minute before the lactic acid build up in your muscles (a byproduct of glycogen metabolism) temporarily prevents you from anaerobically metabolizing intramuscular glycogen.
While this has been happening, your body has been firing up its aerobic energy production system. You can tell it’s working because your breathing rate increases in order to provide the oxygen needed to power the aerobic chemical reactions.
Your body’s preferred aerobic fuel is fat because it’s energy dense and you have a lot of it. As you continue increasing your exercise intensity, your energy needs will eventually outpace the ability of fat to supply it. When that happens, your body will begin using its carbohydrate stores as an aerobic fuel source because it can supply energy faster, and it requires less oxygen to power the process.

What are heart rate zones?
Heart rate zones are ranges of the percentages of your maximum heart rate (HRmax) between which the body is said to receive certain health benefits. In order to make sense of these zones, you first have to know what your HRmax is.
Maximum heart rate
The most scientifically accurate measure of your HRmax is achieved via a maximal exercise test, which typically takes place on either a treadmill or exercise bike. During a maximal exercise test, you will run/pedal at progressively higher speeds until you can’t continue. Your peak heart rate during this test is your HRmax2.
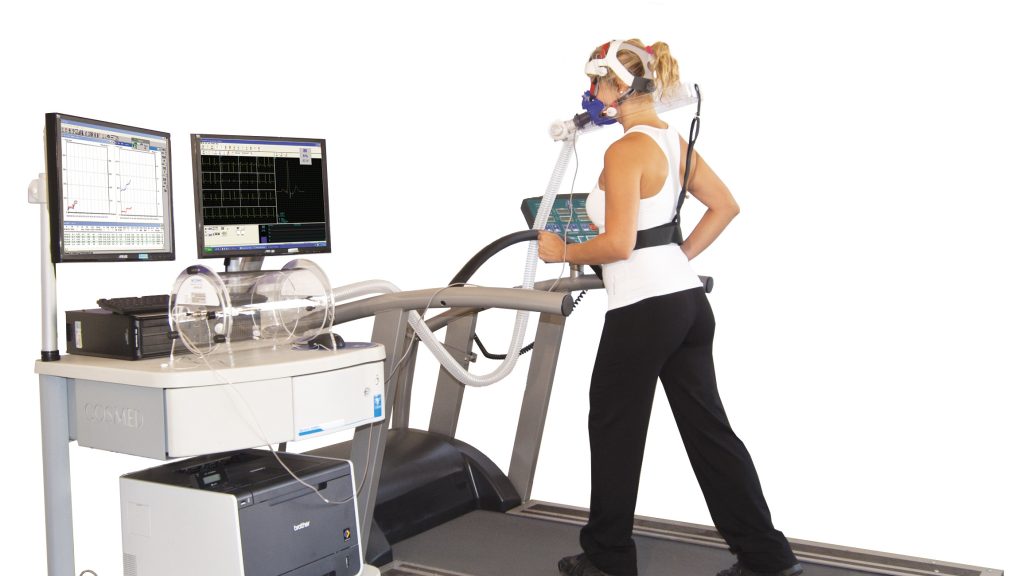
Because these tests cost around $100 and require expensive equipment, most people use an age-predicted heart rate formula instead. There are a bunch of these formulas out there, but, according to the International Journal of Exercise Science, 220 – age is the best choice in most situations.
Age-predicted maximum heart rate
| Age | HRmax |
| 20 | 200 |
| 25 | 195 |
| 30 | 190 |
| 35 | 185 |
| 40 | 180 |
| 45 | 175 |
| 50 | 170 |
| 55 | 165 |
| 60 | 160 |
| 65 | 155 |
| 70 | 150 |
| 75 | 145 |
| 80 | 140 |
The Physical Activity Guidelines for Americans
The U.S. Department of Health and Human Services (HHS) publishes The Physical Activity Guidelines for Americans, which has two zones: moderate intensity and vigorous intensity. Even though having just two is simpler than the four or five used by most others, HHS uses percentage of aerobic reserve to define its zones where 0% is resting and 100% is max effort. HHS defines moderate intensity as 40–59% of aerobic reserve and vigorous intensity as 60–84%. Since these numbers (as defined by HHS) are subjective, you can fall back on the American Heart Association, which defines moderate intensity as 50–70% of HRmax and vigorous intensity as 70–85%.

American College of Sports Medicine
The heart rate zones defined by HHS were influenced in part by the American College of Sports Medicine (ACSM) which has its own table of heart rate zones. The ACSM has five training zones based on percentage of HRmax:
- Very Light, <57%
- Light, 57–63%
- Moderate, 64–76%
- Vigorous, 77–95%
- Near Maximal, ≥96%
Even though the ACSM provides percentages of HRmax to define its heart rate zones, it prefers to use percentage above heart rate reserve (HRR) instead. Calculating HRR is a bit more complicated, but if you know your resting heart rate (HR) and your HRmax, you can work it out.
- Very Light, <30%
- Light, 30–39%
- Moderate, 40–59%
- Vigorous, 60–89%
- Near Maximal, ≥90%
Calculating HRR
Find your HRR by subtracting your HR from your HRmax. Next, multiply your target percentage by your HRR. Finally, add that number to your HR. Let’s do an example.
- I’m 45 so my age-predicted HRmax is 175 bpm
- My average HR over the last month according to my Coros watch is about 75 bpm
- That means my HRR is 175 bpm – 75 bpm, or 100 bpm
- If I wanted to train in the middle of the Moderate training zone, my target would be about 50% so I would multiply my HRR by 0.50 to get 50
- Finally, I add that number to my HR to get my final target: 75 + 50 = 125 bpm3
Polar and Garmin
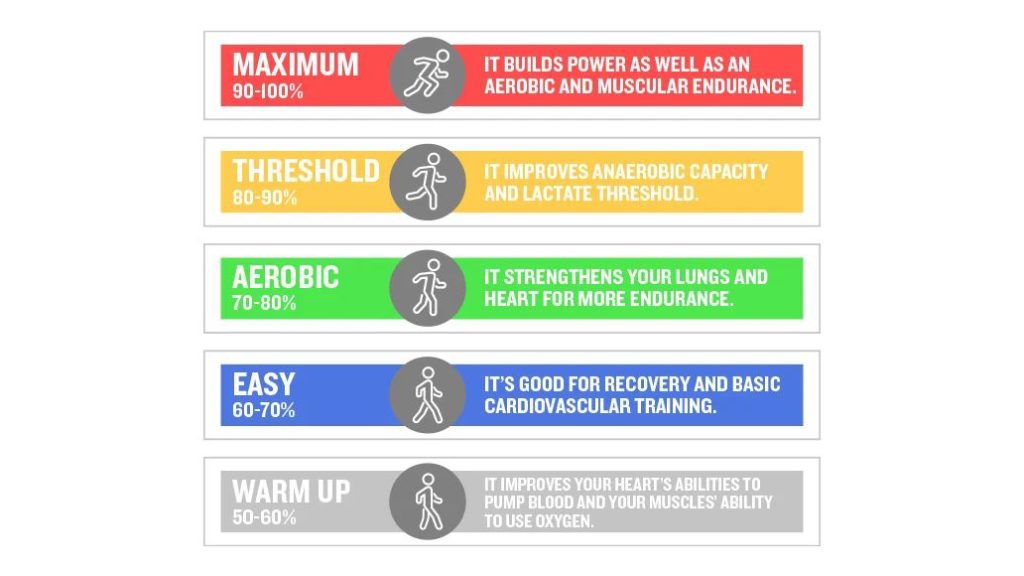
Although HHS and ACSM are the most reputable bodies to have issued heart rate zone guidance, many device makers have as well, chief among them the fitness wearable giants Polar and Garmin. Both companies define their heart rate zones using %HRmax, and both use the same definition4:
- Very Light, 50–60%
- Light, 60–70%
- Moderate, 70–80%
- Vigorous, 80–90%
- Near Maximal, 90–100%
Physiological foundations of heart rate zones
According to Dr. Jennifer Sheid, “there are not specific physiology responses to each heart rate zone.” Dr. Sheid is an Associate Professor in Physical Therapy at Daemen University. But, even though each heart rate zone doesn’t directly correlate to a particular physiological response, “there is a linear relationship between heart rate and calories burned,” Dr. Sheid tells me. In other words, the higher your heart rate, the more calories you are burning.
Elevated heart rate zone
So, the idea of heart rate zones is just a short hand for exercise intensity, but that doesn’t mean that there aren’t different intensity zones. The most basic intensity zone is anything above your HR. A 2013 study published in the European Journal of Applied Physiology found that taking just a “brisk” walk was enough to elicit changes in health. The only catch was that you had to do it three times a week for at least 30 minutes.
Another study published in The Lancet involving over 400,000 subjects found similar results. Individuals in the lowest-activity tier (around 90 minutes of moderate exercise per week) had reduced risk of all-cause mortality5 and had a lifespan three years longer than their inactive peers.

Any prolonged physical activity you do with an elevated heart rate will be fueled by aerobic processes. You can think of this as the aerobic zone, but it is not defined by a fixed number. Like all of these zones, the exact point where it begins and ends varies by age, sex, training status, and other factors6.
As was already mentioned, your body preferentially oxidizes fat because it has a high energy density7 and you have a lot of it. As your exercise intensity increases, your body can’t metabolize fat fast enough to meet its energy needs and it will begin to metabolize carbohydrates/sugars. Even though carbs provide less energy per gram, they can be metabolized faster, making them a good source of energy when you need it now.
Fat-burning and carb-burning zones
If you were so inclined, you could divide the aerobic exercise zone into two parts. At the lower end of the intensity spectrum would be the fabled fat-burning zone, and at the upper end would be the carb-burning zone. Within the broader aerobic exercise zone is a point of maximal fat oxidation (MFO), where your body is burning more fat calories per minute than at any other intensity.

A 2009 paper in the Journal of Strength and Conditioning Research studied 36 runners to find their point of MFO. Although there was significant variability between the subjects, the %HRmax for MFO for 32 out of the 36 subjects was between 60% and 80%, an easy target to achieve.
Having said that, the science is far from established. A 2018 literature review published in Frontiers in Physiology found that there are a lot of factors that go into determining your MFO and the exercise intensity at which you achieve MFO (Fatmax). If you have better aerobic conditioning, you’ll have a higher MFO, because your body has adapted to be better at burning fats. Males have a higher MFO, but females have a higher Fatmax. One study showed that running induces a higher MFO, but another showed little difference between running and cycling.
Anaerobic zone
As you continue to push yourself, aerobic metabolism will not be able to power all of your exercise needs and your body will fall back on anaerobically metabolizing intramuscular glycogen stores to compensate for its energy needs. Below a certain exercise intensity, your body will be able to remove the lactic acid build-up before it fatigues your muscles, but after a certain point, often called lactate threshold (LT), the rate of lactic acid accumulation will outpace your body’s ability to get rid of it, leading to exhaustion.
There is some debate on how to precisely define LT, but for noobs like you and me, what’s important to know is that high-intensity training below this level will raise your LT due to your body becoming better at aerobic metabolism. Training beyond LT will build up your lactic acid tolerance, allowing your muscles to continue working in the presence of higher levels of lactic acid. The LT is generally somewhere around 80–90% of your HRmax.
Keep moving
Unless you’re an elite athlete, knowing exactly where these thresholds are isn’t going to offer you much utility. Instead, knowing some of the science behind what these zones represent physiologically, can help you set smarter training goals for yourself.
- on the order of milliseconds ↩︎
- maximal exercise tests almost always also measure the maximum amount of oxygen uptake you are capable of (VO2max) which can be a valuable metric. ↩︎
- incedentally, this is just slightly higher than the middle of Moderate training using the %HRmax numbers (70%) which would give a target heart rate of 122.5 bmp. ↩︎
- both also allow you to set your own zones on their devices. ↩︎
- all-cause mortality is the total number of deaths in a group. In this case, the low-tier exercise group had fewer deaths (from any cause) reported than the inactive group. ↩︎
- the ACSM puts this number at roughly 50% of HRR. ↩︎
- fat can produce 9 kcal of energy per gram while carbohydrates can only produce 4 kcal/g. ↩︎